Posted on November 27, 2018 in Uncategorized
One of the first biases a data scientist can introduce into a data project is model selection. Therefore it has become standard to evaluate data using a variety of modeling approaches. A recent HBR article, Why “Many-Model Thinkers” Make Better Decisions by Scott E. Page, explores the benefits of using many models to evaluate data.
Intuitively it makes sense that to get the full picture, a different angle can be more insightful than increased focus. There are many ways to improve a single model to the extent that data analysts may be tempted to over-fit, designing models that are so specific that they tend to perform poorly when put into use.
In order to apply different models, the question asked of the data may need to change. For example, credit card data is frequently used to forecast quarterly revenues for a company. In addition to making a numerical forecast, a different model can be applied to evaluate whether a company is likely to beat or miss consensus revenue estimates. Yet another model can be used to generate a probability curve for a range revenue estimates, perhaps validating an analyst’s financial model.
Not only does a multiple model approach reduce bias, it also provides a level of confidence in predictions. Data which is more uniform will tend to provide similar results when analyzed using a variety of techniques. The opposite is generally true of data which is more quirky. Multiple approaches to data examination may bring attention to data characteristics that should be taken into consideration, perhaps by building yet another model. The increased understanding that comes from applying multiple models to a dataset is obviously missed when analysis is not done internally. When an asset management firm purchases a prediction from a third-party research provider, they have no idea to what extent that data has been processed and analyzed. An exception is a firm such YipitData, which provides predictions but also provides access to the underlying data and consultations with analysts who have worked with the data. Building internal data analytics capabilities may be difficult, but it is part of the fiduciary responsibility that managers are entrusted with.
Posted on November 13, 2018 in Uncategorized
My previous post elaborated on why asset managers need to develop a data strategy and this post follows by addressing how to build an effective data strategy. A data strategy consists of a set of responsibilities that ensure that the right data gets in front of financial analysts, investment managers, traders and asset allocators. The “right” data is data that:
- Is relevant to an investment manager’s approach.
- Passes legal and compliance requirements.
- Has an acceptable level of data quality.
- Has been shown to provide reliable signals in the past.
The data strategy is also responsible for making this data digestible by investment personnel. Sometimes this is as simple as subscribing to a service, but in other instances it may involve significant data engineering and data processing. A data strategy should also involve methods for assuring that data is applied correctly in investment decision-making.
The pace of data integration into investment analysis may be slow because of the complexities involved in designing and implementing a data strategy. There isn’t a cookie-cutter design or org chart for implementing one and instead there is a wide variety of data related roles, positions and corporate structures. However, there are specific areas of responsibility that an effective data strategy encompasses to reach its objectives, and these will be discussed below. How the implementation takes place is part of the secret sauce of asset management, but there are some common features and approaches discussed here. An effective data strategy will have a high ROI. That can be tricky to quantify so the last section of this blog post touches on approaches to measuring the ROI of a data strategy.
Data Strategy Responsibilities
Data sourcing: Suggestions for new data sources may come from analysts and portfolio managers. Traditionally this has been the case since it is the analysts’ responsibility to be on top of the information flow for the sectors they cover. The environment of data ubiquity that we live in ironically makes data sourcing more difficult because there is so much to evaluate. There are efficiency gains to be made from designating data sourcing specialist(s) that understand the investment applications, are able to make apples to apples comparisons of the value proposition of each data service, and can spend time scouting for data sources.
Data due diligence: Once a data source is identified as potentially adding value, a data due diligence evaluation is carried out. Data sourcing and data due diligence consolidated under one, or just a few, individuals is advantageous because the process can become standardized, with a formulaic process yielding greater consistency and efficiency. Data due diligence that uses a standard questionnaire, or metadata schema, allows for systematic cataloging of data characteristics. Maintaining a metadata catalog helps to monitor the data landscape. Ideally a catalog would contain information about sources that are currently or were previously licensed, sources that have been evaluated in the past, and sources which may be evaluated in the future. Some industries use fairly standardized metadata schemes and similar standardization is being discussed among asset managers.
One objective of data due diligence is gaining an understanding of the origin of datasets, why a particular source of data exists and the party responsible for commercializing it. This understanding is needed for both legal & compliance review and for data quality assessment.
Data due diligence obtains the information needed to assess the amount of data engineering resources that may be needed to work with a data source. Characteristics such as data size, type, format, and delivery method are used to determine whether a firm is prepared to work with a data source. Established delivery mechanisms such as APIs typically present fewer engineering challenges than raw, large datasets that need multiple servers to process and clean it. While a firm may be able to process certain datasets, it may be prohibitively costly. If a dataset is not mapped to security identifiers, such as an exchange specific stock symbol, then the cost of doing so must be taken into consideration. The same is true of brands and businesses that are not mapped to a parent company.
Legal risk & compliance evaluation is mostly centered on:
- Whether the owner of the data has the appropriate rights of data ownership and commercialization. This includes considering legality of the method of data collection and whether the data contains material non-public information (MNPI).
- Personally identifiable information (PII) present in the data. It is problematic because many legal jurisdictions regulate its handling and usage. PII is not necessary for investment research because asset managers are concerned with behavior in the aggregate, not at the individual level. In order to comply with regulations, the best approach is to simply avoid datasets which contain PII, or to scrub PII out of a dataset. This can be complicated because legal jurisdictions and regulations vary in their definition of PII. Additionally, while a dataset may not contain PII on its own, it could contain data that, in conjunction with other available data, constitutes PII.
- Indemnities provided by the data owner regarding third party intellectual property claims and other potential liabilities (legal actions, etc).
The climate around the legal points mentioned above is dynamic with GDPR recently implemented in the EU and data privacy legislation introduced or under consideration in countries worldwide, including the U.S. The legal grayness around web crawling merits attention as well. Firms with a strategic approach to data usage can benefit from and collaborate with industry organizations such as the Investment Data Standards Organization (IDSO). The IDSO is an independent non-profit organization whose aim is to promote standards and best practices that asset managers can adopt when working with alternative data in order to limit compliance and legal risk. IDSO was formally launched in February 2018 and its publications include:
- PII best practices and compliance checklists
- Data due diligence questionnaires
- Web crawling best practices and compliance checklists
Data architecture/engineering deals with the collection, storage, and organization of data, as well as tools for analysis. Data architecture, and the engineers who design and manage it, are at the heart of a data strategy. With increased data usage occurring in all facets of the asset management business, not just research, data management has become more important. Historically data management has been ad hoc at most firms, growing without the foresight of normalization and interconnectivity. Data assets that are managed comprehensively can, in theory, yield greater IT efficiency and be more scalable. Investment teams that have the support of data engineers who manage data for them are freed from time consuming and potentially error-generating processes. Data engineers can also provide better data delivery in the form of dashboards and customized files and reports designed by data scientists and data analysts.
Data engineers, together with data scientists, select the database management systems and analytical tools that are the most dependable and economical given the tasks at hand. Different tools may be used for different analytics functions; data quality analysis, data cleaning, machine learning, predictive modeling, etc. The optimal systems and tools are dependent not only on applications, but also the regulatory backdrop, legacy systems, and firm policies regarding outsourcing.
AWS cloud computing is quite popular among hedge funds and some other investment managers. The ease of sharing data via AWS S3 buckets is an attractive feature as are the plug-and-play database management systems available on the platform. Asset managers frequently store data in flat files that are then loaded into the best database system given the analysis that will take place.
The data architecture needed to support fundamental investment strategies is relatively less sophisticated than that needed in other industries. Analyzing streaming data is more complex than daily or monthly data, for example. While trading desks use streaming data, long-term investors don’t. Additionally, much of the big data processing is done by the data owners prior to it being licensed to asset managers. What asset managers frequently receive is aggregated and processed data.
However, as in-house data analytics becomes more complex, so does data architecture. An example of a project employing hefty data engineering resources is Business Science University’s mortgage prediction app. The web app provides user friendly visualizations of the default risk for 38 million mortgages in the U.S. To determine default risk, a 500 GB dataset from Fannie-Mae was used to train a model. The computations used 512 GB of RAM. Data crunching of this magnitude will only become more common and the need for intuitive graphical interfaces will not go away. Data engineers use tools such as Tableau, Shiny and Django for customized visualizations and dashboards to bridge the gap between fundamental analysis and data.
Data quality analysis is done on sample data or a full dataset to determine data reliability for specific research purposes. Standardized review procedures will examine for:
- Clarity and consistency in units of measurement.
- Missing data.
- Distribution of observations and analysis of outliers.
- Variations in panel size.
- Accuracy and completeness of mapping to security identifiers and/or parent company.
- Restructuring required (ex: splitting a “city, state” field into a field for city and a field for state).
- Adjustments required (ex: indexing and setting up tables).
- Presence of third party data embedded in the dataset.
- Presence of PII, or data which would lead the asset manager to have PII.
Some people argue for approaches that involve allocating scores, or pass/fail ratings, based on levels of data quality. While attributes such as those mentioned above can be scored, the interpretation of them depends on the data application. For example, the tolerance for missing data or panel bias may differ based upon how the data will be used. Additionally, qualitative factors, such as the context of the data’s origin and the data application purpose, don’t translate well into quantitative scores. Data quality analysis is best done when there is a human’s understanding of the data under review, not just output from scores. Some datasets are obviously junky and easily rejected. Ultimately the decision to accept or reject a dataset for further exploration is a concerted judgement call by those who would be involved with the data.
Data application analysis, frequently referred to as “alpha” analysis or testing, involves determining whether a data source contains value added information for investment personnel. It answers the question: does the data provide a reliable signal or is it mostly noise? The purpose of the analysis is not to build the best predictive model with the data. Rather it is to determine whether the data shows signs of having informational value. Fine tuning its application is a separate process.
Two types of approaches to evaluating datasets are depicted below. On the left, the “Broad Evaluation” approach involves identifying metrics in a dataset and then determining whether those metrics correlate with subsequent stock price performance, or relative price performance. Other metrics, such as revenue KPIs, are frequently used for evaluation as well. The delicate issue is which dataset metrics are selected for evaluation, particularly when there are many that could be combined, averaged, etc. While this approach in theory is scientifically valid, in practice it is not free from subjectivity. As Nobel Laureate Ronald Coase notes, “If you torture the data long enough, it will confess”. Much of this can be sorted out when it comes to model building and the separation of training vs. testing data. The initial alpha analysis is simply asking the question of whether there are signs that the data is worth working on.
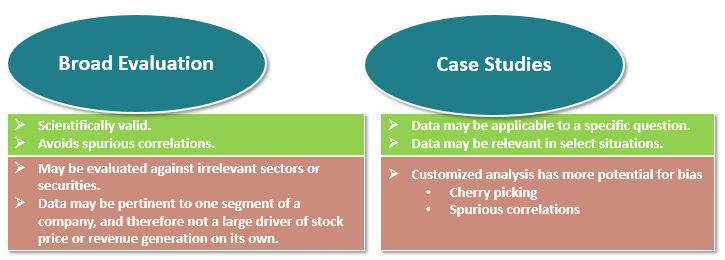
On the right-hand side of the image above, the pros and cons of a “Case Studies” approach are listed. Case studies can make sense when the data application is story specific but at the same time can be checked against ground truth data. For example, social media data may be evaluated in the context of a variety of situations such as new product launches, price increases or promotions, product defects, social controversies, etc. If the social media metrics can be compared to relevant “ground truth” data, then a group of cases studies can be used to evaluate the quality of the signals seen in the data. Identifying a set of use cases that can be analyzed jointly is cumbersome and subjective but is a good alternative when a broader evaluation is not possible. It also has the benefit of being intuitive for fundamental investment managers.
Data science needs vary by dataset and by investment approach. In some cases, datasets do not require any additional processing or analytics before being used by research analysts. Unstructured data, such as text and image, do require data science work to extract information but this work is not always carried out in-house. Nevertheless, data science efforts are growing strongly at asset management firms as advances, and accumulated experience, in machine learning and artificial intelligence hold great promise for improving investment research and investment strategies. Frequently data science tasks include:
- Data cleaning, adjusting, indexing, aggregating.
- Text analysis, image analysis.
- Descriptive analysis.
- Predictive modeling for quantitative strategies.
- Estimating corporate KPIs or macro/industry statistics.
- Developing signals, alerts and proprietary indices.
- Designing dashboards and reports containing data and results of analysis.
Arguably the most important aspect of data analytics work in asset management is assuring that investment personnel understand the data, or analysis, and that they are applying or interpreting it correctly. The scope of that topic is beyond this post but some examples of the pitfalls in data interpretation are entertaining to consider.
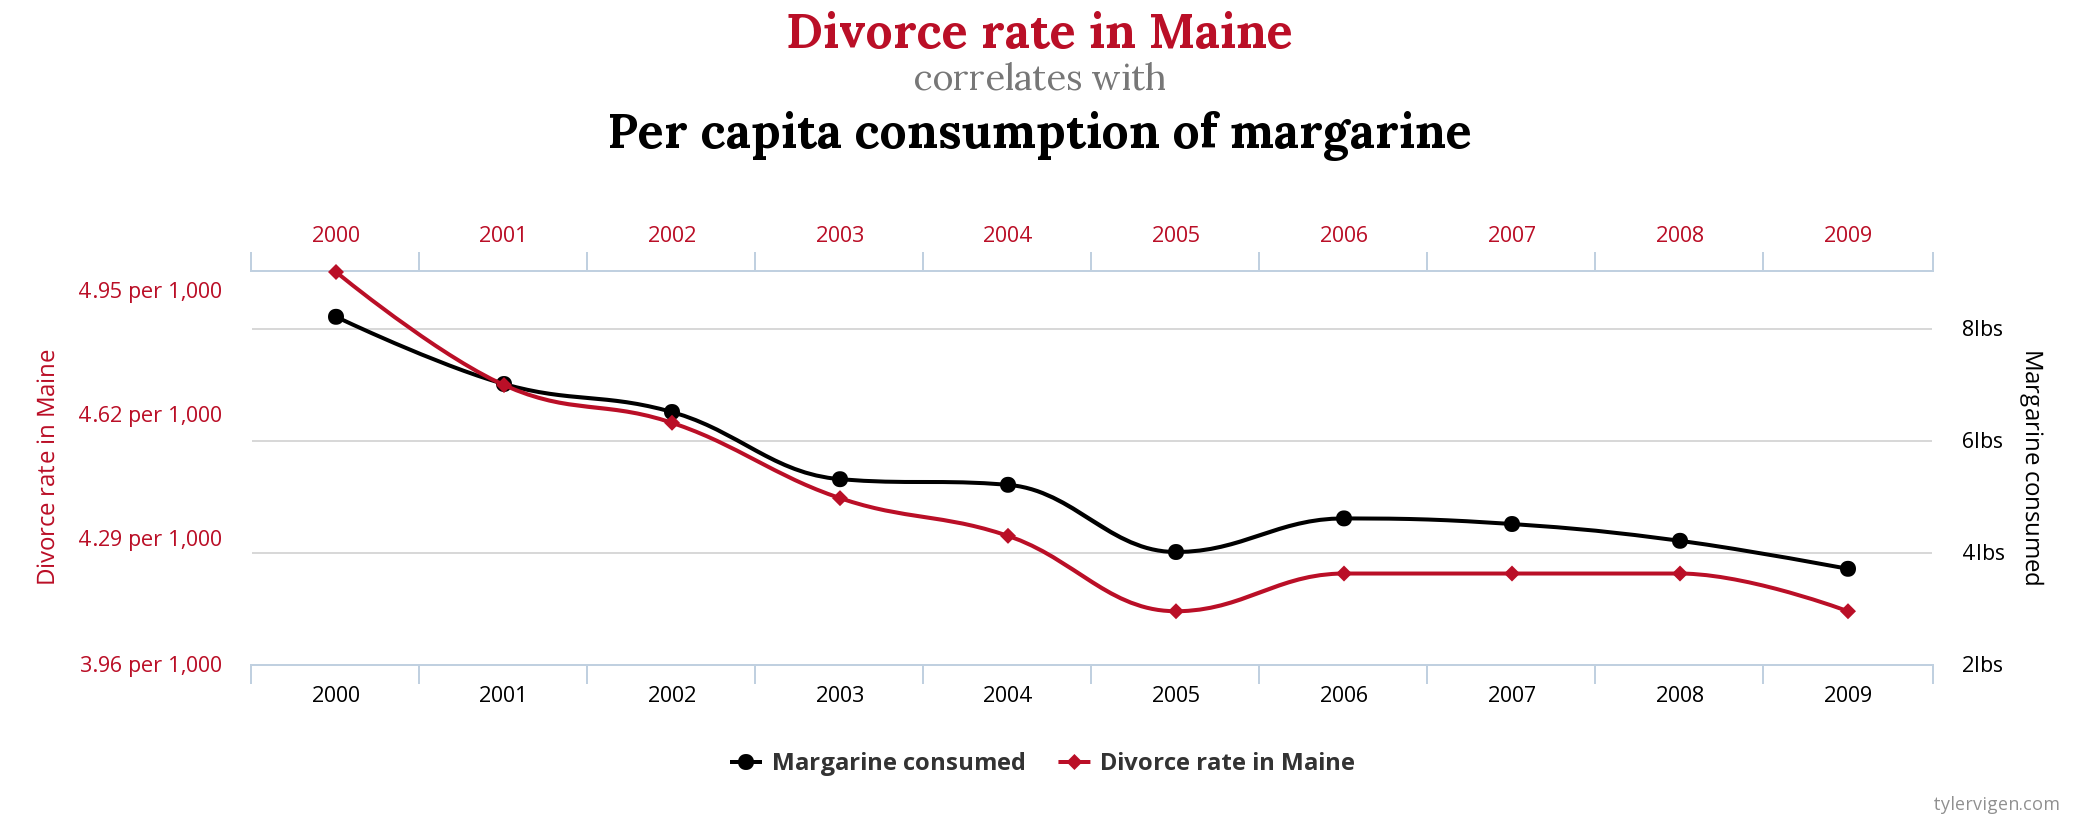
For example, spurious correlations are everywhere as seen in the chart below from Tyler Vigen’s blog on the topic.
While statistics don’t lie, they can be insufficient in their explanatory power.
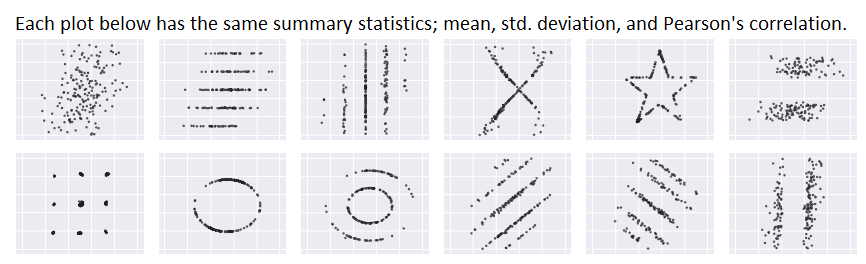
Some data is more susceptible to modeling and/or interpretive bias than other data. Different choices in modeling the same data points below lead to different conclusions (and vice versa).
A recent Factset article is another example of data analysis being so incomplete that it’s not useful. The article stated that fewer mentions of tariffs on corporate earnings calls for Q3 2018 vs. Q2 2018 “may be a sign that there is slightly less concern in corporate America about widespread impacts from the tariffs throughout the economy”.
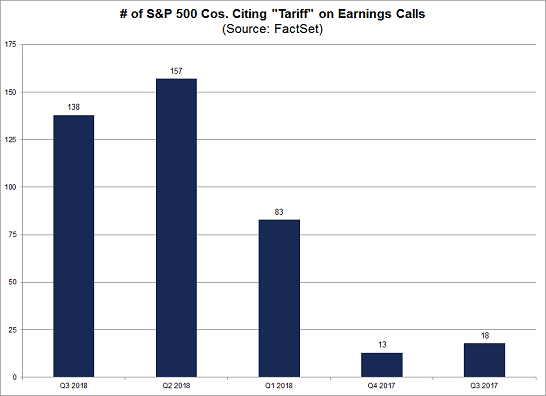
In order to reach that conclusion, data analysis would need to quantify the volatility of topic mentions on corporate earnings calls. The 5% difference cited could be in the range of normal. Without looking closer at the data, it cannot be presumed that all discussions of the tariff topic contain either the singular or plural of the word “tariff”. A comment may refer to a “trade war” instead, for example. Similarly, a mention of the word tariff does not necessarily refer to recent U.S./China trade developments. These concerns may have been addressed by the analyst and what is published is simply a summary of the results. The reader, however, before using this information needs to examine these and other questions. A research analyst or portfolio manager may not have the skills to audit or review the quantitative work done by third party research providers.
As the publication of research based on new data and new data techniques grows, it is becoming increasingly important for investment analysts to be data literate. A data strategy can make concerted efforts to improve a firm’s data literacy by leading internal discussions around data applications.
Implementing a Data Strategy
Organization charts for implementing a data strategy come in many shapes and formats. Gene Ekster’s chart in his 2015 white paper on alternative data has resonated with many investment managers.
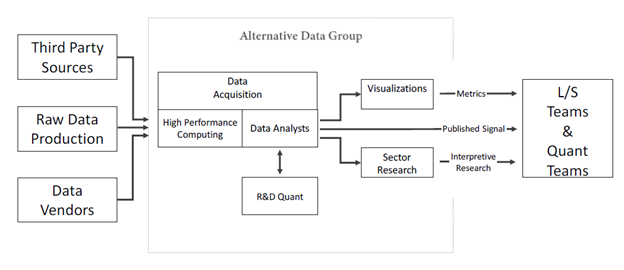
An approach by a U.S. based asset manager with a large market share in both retail and institutional savings looks more like this:
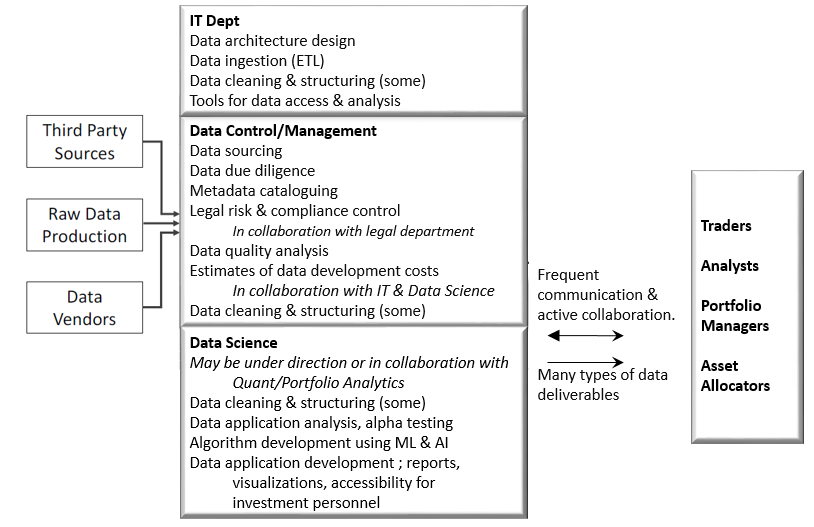
Alternatively, data lake imagery is another way to depict the flow of data to investment personnel. Many firms have data lakes with some data, if not all of their data. Ideally the diagram below would also show data being piped directly from the countryside to the end user (4) as tools such as Bloomberg and Factset are mainstay in the industry.

While the images above are helpful for illustrating the components of a data strategy, they don’t address the leadership issue. Frequently, asset management firms are designating Chief Data Officers (CDOs), or similar positions & titles, to manage their data strategy. In a recent white paper co-authored by EagleAlpha and the recruitment firm Options Group, Jonathan Neitzell, Chief Data Officer at Goldman Sachs Asset Management, and Paul Booth, Global Head of Data at BlackRock Active Equities provided their thoughts on data strategy leadership.
Jonathan Neitzell:
“Why Designate a Chief Data Officer (CDO): Most large financial institutions have many distinct silos of excellence. However, I’ve found that these business units are rarely integrated, and the industry is missing the opportunity for insight exponentially increased by the number of teams involved. I expect the CDO role to evolve as the voice and opportunity of Data – representing a strategic and offensive asset. The CDO assigns a high priority role to Data to enhance translation, vision, and strategy across an organization.
CDO Objectives: The focus must be commercial – growing the opportunity relative to long term secular road maps and how we ultimately best serve the business unit stakeholders and customers. As such, I maintain that it is critical for the CDO to regularly interface with the business unit top executives (including CEO), as particularly early on one is navigating a sea of intangibles – often across various teams to bring about long term impact. Less than consistent interaction and dialogue has the potential to risk mission hijack.”
Paul Booth:
“Innovation and constant finessing of the data model is essential in a tough and competitive market but it must be balanced with strong data governance. As recent corporate crises have shown, data breaches go hand-in-hand with bottom line and reputation value destruction. That’s why a Chief Data Officer (CDO) function must be part of – and strongly supported by –the organization’s senior leadership team, and that their agenda is integrated across business units and backed by appropriate resources to do their job properly.
Given the speed of technological change, the CDO function (either as a separate role or part of the CIO/Investor mandate) should be given room to lead and grow, being complemented by investment teams open to trying new things. In return, CDOs must be great communicators able to make the case for change and demonstrate how “doing different” can reveal high quality alpha. And ‘different’ should not be confused with ‘radical’. Alternative and unusual data sources augments the investment decision process; it does not replace it. There is a great misconception that a single new data source will solve the question – this is not the case. Moreover, hiring a handful of data scientists and expecting them to “figure it out” does not and will never work. It needs a team with blended skills involving data management, data science, industry and sector equity domain expertise, financial markets expertise, data visualization, tool development, data hunting,negotiation skills and so on.
CDOs must understand how equity markets work, how different sectors operate, what questions are posed by fundamental investors, and what data to apply. The data and investment teams should work constructively with each other to push the boundaries and get the best results. In addition to the incoming requests from investment teams, my team is tasked with anticipating questions and proactively researching new data sets to answer questions yet to be posed by colleagues.”
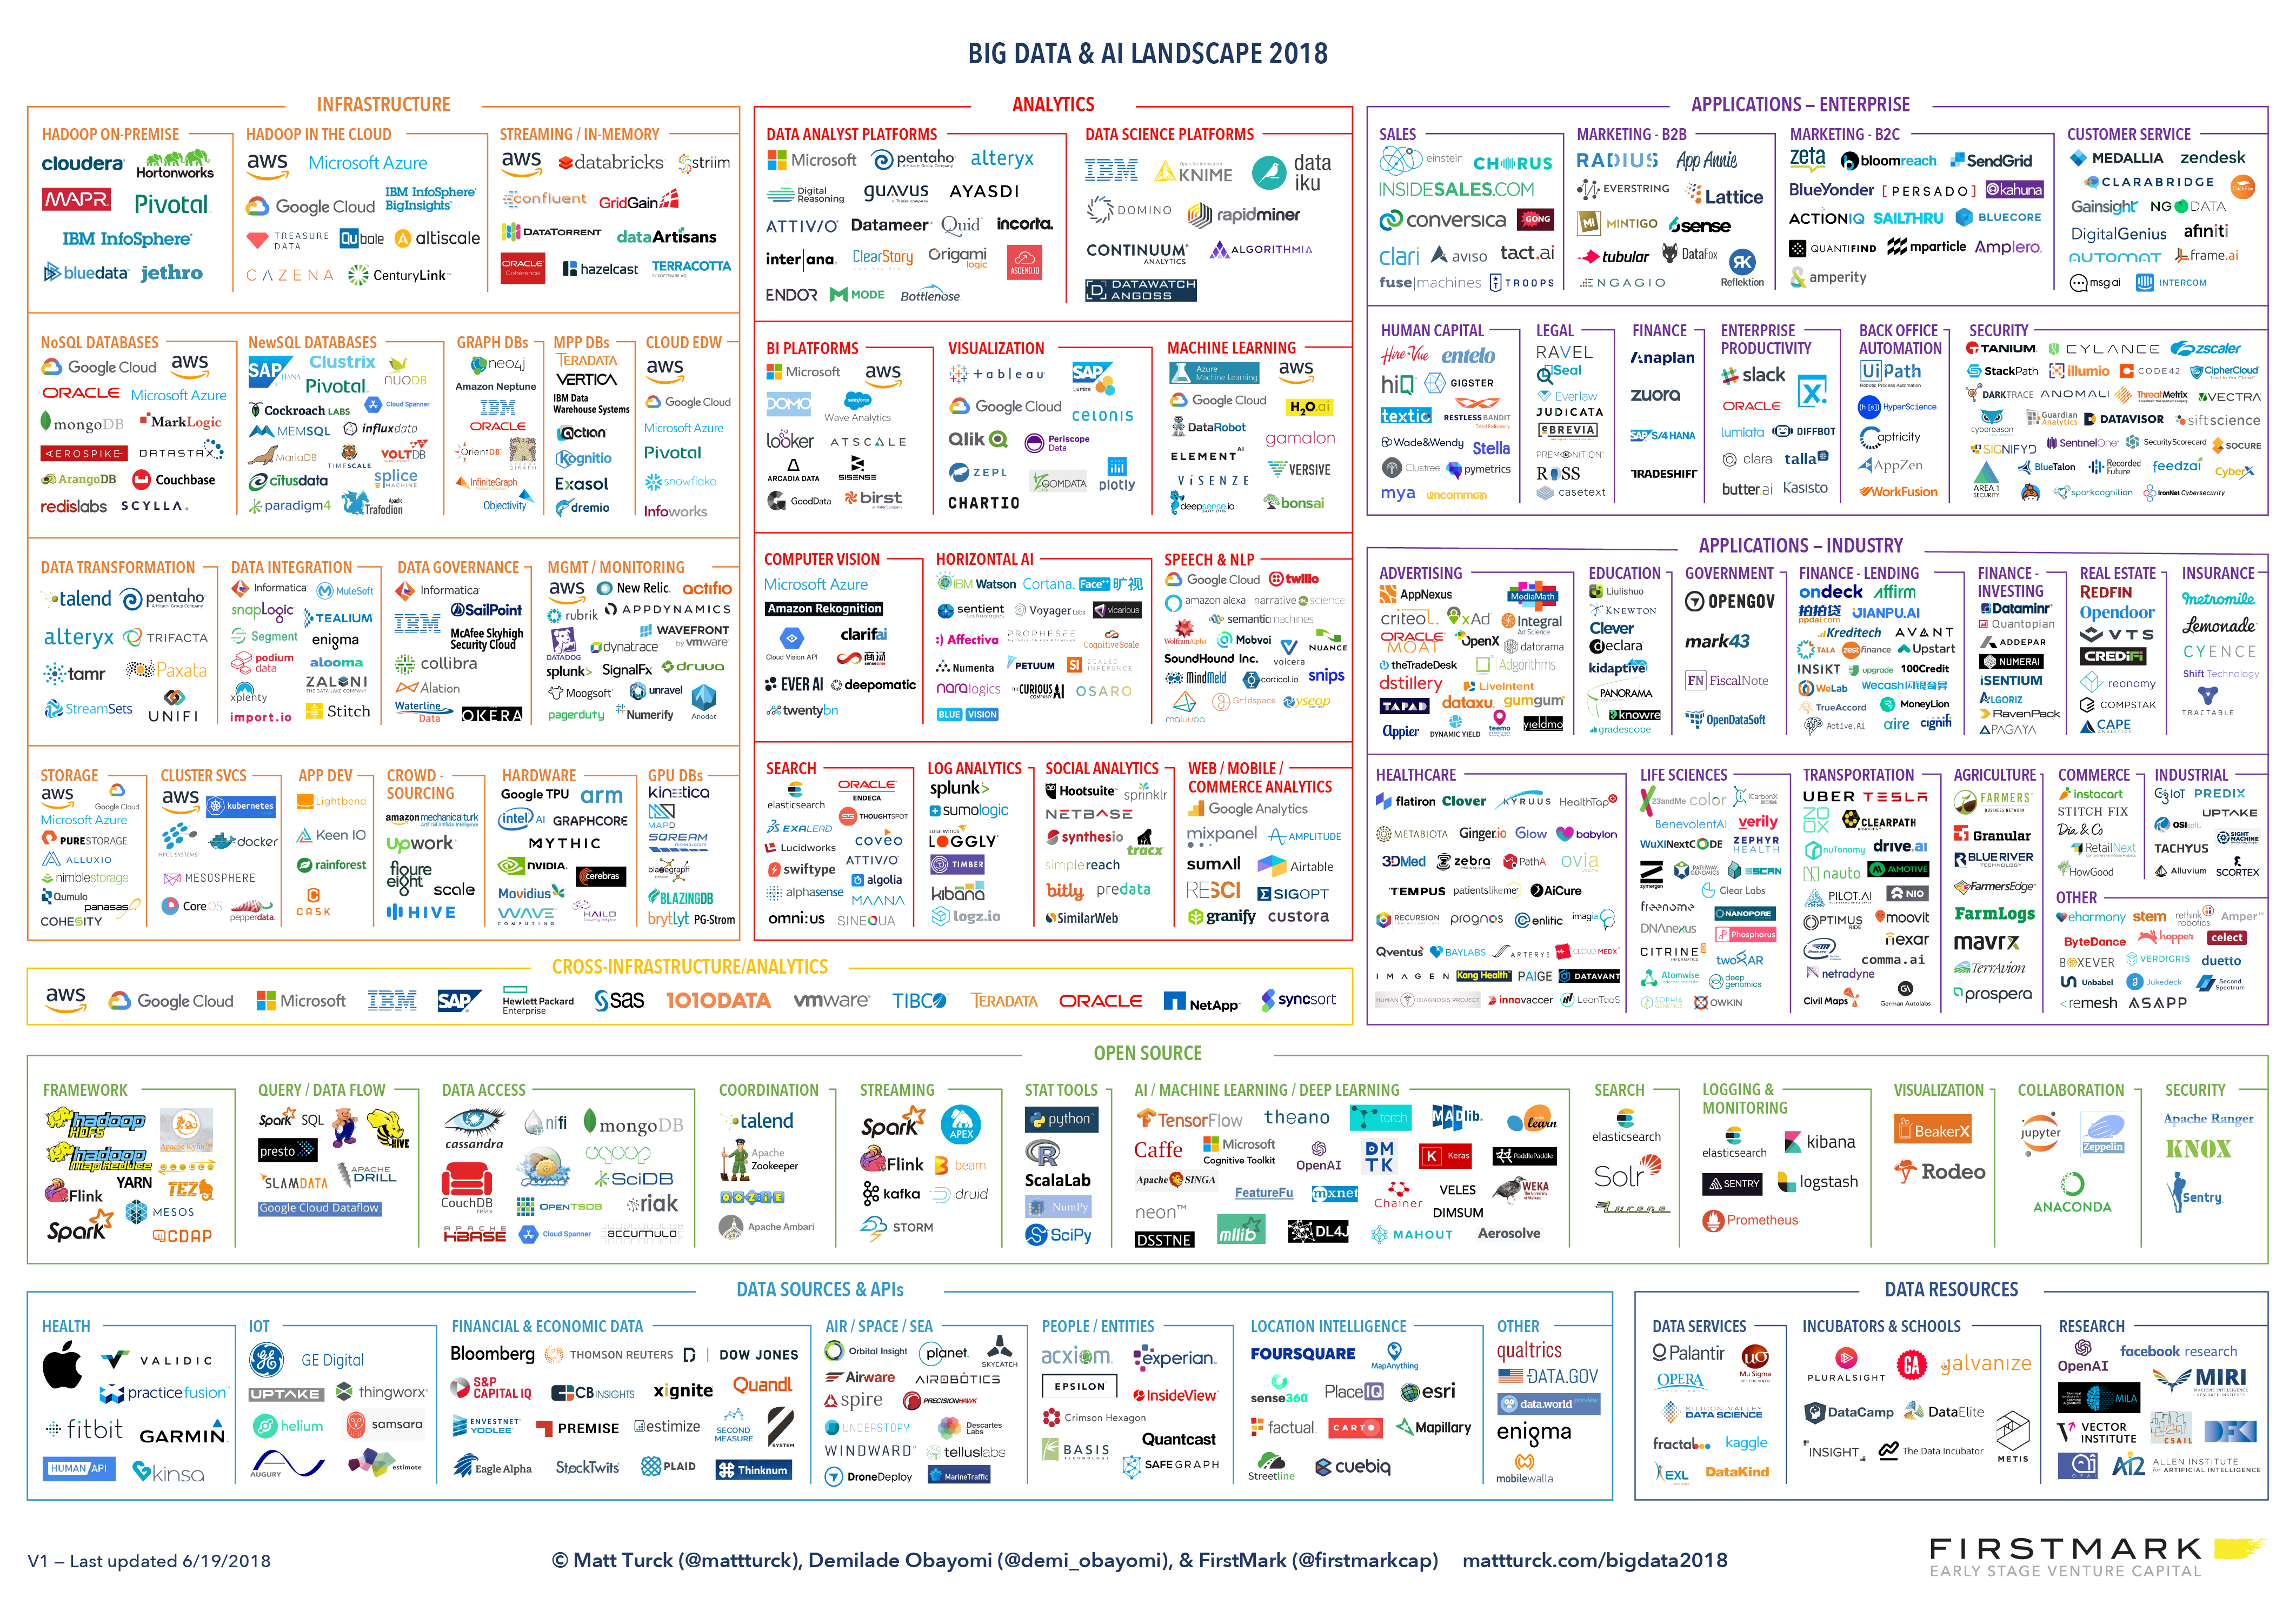
Because a wide range of specialized expertise is needed to manage a data strategy, a CDO is best equipped to evaluate the build vs. buy options for strategy execution. Outsourcing is another complex topic that merits its own blog post, particularly since there is no shortage of third-party firms firms providing data services. Matt Turck provides a crowded infogram of service providers in his Big Data & AI Landscape in 2018. The alternative data service provider AlternativeData.org has developed a similar infogram of alternative data providers for the investment management industry. Finally, there are many providers of bespoke data-centric research, such as Eagle Alpha’s Bespoke Projects product.
Data Strategy ROI
Understandably, there are no figures available on industry returns on investments in data and data capabilities. There are indications of favorable returns. Many people cite increased investment in the field as evidence of favorable returns being generated. In a 2017 Greenwich Associates survey, nearly all investment managers interviewed stated that they were seeing a positive return on their investments in alternative data.
Estimating ROI involves considering the cost element and the return element. The cost calculations should include all data related costs including personnel, data, servers, and research/analytics services. Some of these costs will be allocated to trading and some to research. The return on investments in trading is viewed differently than returns on research. Trading has the obligation of providing best execution for client funds. Data costs are therefore viewed as part of the investment needed to provide best execution. Short-term discretionary funds may use the same data sources as traders, and their ROI can be calculated independently. For investment research, once data costs are quantified, those expenses can be integrated into the department budget and the impact on margins evaluated.
The difficult issue when evaluating ROI on research related data costs is attributing increased revenues to the implementation of a data strategy. Because so many factors influence stock price performance, and many factors influence manager performance, even attributing performance to data sources or data analytics processes is an art rather than a science. Data is often part of an information mosaic and it is a judgement call as to how influential the data mosaic was to the overall information mosaic for a given investment. One approach is to evaluate the largest contributors to portfolio performance and make a categorical assessment as to whether the investment position was influenced by the firm’s data efforts (ex: rank on a scale of 1:5). Focusing on the largest components may facilitate identifying when value was added and where there were blind spots.
Documenting the information sources used in investment decision-making is not something all asset managers have adopted, but awareness of its importance is growing. If the usage of data sources or data analytics are tracked on an investment basis, then a track record of attribution can develop over time, even at the dataset level. Some managers have suggested tracking analyst data usage via logins to data interfaces, the number of consultations with data personnel, and/or the number of requests for data projects. However, data access and busyness does not necessarily go along with investment success. Therefore, investment specific tracking of data usage is what is needed rather than tracking of data asset utilization generally.
By the time it becomes evident that data strategies are improving fund performance, however, many asset managers will already have highly evolved data strategies. Some successful fund managers with strong track records and niche, formulaic investment approaches have questioned whether they really need to have a data strategy now. It will certainly take time for the competitive advantages of an effective data strategy to play out. While boutique firms with strong performance can afford to hold out, eventually the lack of data sophistication will become a hindrance, particularly in terms of attracting new talent that prefers to be at a firm with deeper resources. Capital allocators also prefer firms with depth in data expertise as data analytics has shown to pay off across industries. These issues cannot be quantified into a long-term boost to ROI, but also cannot be ignored.
While superior risk-weighted fund returns over time correlate with increased assets under management, and hence revenues, the correlation is loose. The specific revenue impact that comes from strong fund performance which was driven by a data strategy varies by firm given the varying strength of distribution channels, company reputation, etc. Fee arrangements that are based on fund performance make it is easier to allocate returns to investment research and hence data resources employed. The majority of the early adopters of alternative data sources were funds with incentive fee arrangements.
A rule of thumb may be as good a rule as any. An Eagle Alpha white paper advising data owners on how to commercialize their data for the asset management vertical states:
“Quants or systematics typically require at least 10x as highlighted in this comment by a quant fund: ‘methods of paying for data vary but most funds will typically be paying out of money they earn on performance fees. At an (optimistic)10% performance fee, a $100k dataset has got to improve overall performance by$1M a year – every year – just to break even. Given the uncertainty around future performance, most funds would need to make several times more than that to be happy to pay for a dataset’”.
Conclusion
An effective data strategy is one that improves (risk adjusted) portfolio returns while still meeting all compliance and legal requirements the asset management firm adheres to. The coordinated execution of data strategy responsibilities is the best way to extract insights from data. Because the data landscape is so dynamic, a data strategy will weigh options for outsourcing, take advantage of industry affiliations, and stay up to date with the latest data sources available. Furthermore, the improvement in fund returns will stand the test of time if the data strategy is built on proper data science principles that are interpreted and applied correctly. An effective data strategy is not possible without widespread data literacy among investment personnel, but at the same time an effective data strategy has the potential to dramatically raise data literacy levels. Finally, a data strategy does not simply appear; it needs leadership.
Posted on November 7, 2018 in Uncategorized
“If we want things to stay as they are, things will have to change.”
We are all familiar with extraordinary statistics about the abundance of data. With an estimated 90% of all data having been generated in the last year, and device connectivity in its nascent stage, data growth will continue exponentially. Our data-rich world is spurring structural changes in the asset management industry. Like other disruptive industry innovations,data brings opportunities for asset management firms to enhance their returns while at the same time creating challenges for those firms unprepared to deal with the data deluge. For systematic firms, data analytics is at the core of their investment strategy. Many of these firms are gaining assets faster than the industry overall, although there have been hiccups in performance.
Other large asset managers, such as Fidelity, Goldman Sachs Asset Management and Capital Group, are developing well thought out data strategies to complement their current research processes. “Quantamental” investment approaches where quantitative techniques are incorporated into fundamental investment research (and vice versa), is slowly garnering increased attention. Yet many firms have not addressed the question of how they will take advantage of the amount of data available to analysts.
Traditionally the domain of fundamental investment analysts, data has now become too complex to be managed at the analyst level. Even though there has been little change in traditional information sources such as financial reports, securities price data, and certain government data, there are many new data sources available that can be used to verify an investment thesis or evaluate business risks. Many of these new data sources are unstructured, in the form of text and images, while other new data sources are large datasets. This makes many of the new data sources out of reach for fundamental analysts who do not have access to data analytics resources.
There has been a lot of buzz around “alternative data”, the term used for data that has not been traditionally used by asset managers. It can be a matter of interpretation as to which data is “alternative” and which is “traditional”. It is clear that alternative data is growing rapidly as new data, such as that generated by mobile phones, is appearing. However, the distinction between the two data types is less important to investors as traditional data becomes increasingly big and new methods emerge to analyze it.
New analytical approaches to traditional data are yielding insights previously not available. For example, graphical depictions of corporate connections derived from government filings are now available on a broad scale. Sentiment analytics provider Prattle specializes in central bank statements and has generated a strong track record of predicting central bank actions. Programs can scan pdf loan documents in a CDO and populate a spreadsheet with key data points from the documents. Even without tapping into alternative data sources, the need for more data analytics capabilities at asset management firms still stands out.
Many investors believe there is no reward in chasing new data sources as the best data sources will survive the test of time. Gains from being an early user of a new data source which contains “alpha” (value added information) can be eroded by losses from using new data sources that don’t provide reliable signals or information. While there is merit in this argument, there is a growing amount of data that seems to be surviving the test of time. It can be difficult to know which datasets those are, particularly as the volume grows. Years ago there were smaller numbers of new data sources emerging, such as First Call Analyst Estimates, and it took time for investors to adopt them. Now there are hundreds of new data sources and hundreds more in various stages of preparation for commercialization. Gauging the value of data by its popularity is no substitute for thorough data analysis.
Because of the growth in data and the new ways of analyzing data, it’s clear that asset management firms need to have a data strategy, regardless of whether the firm has made a commitment to leverage alternative data. The mission of a data strategy is to get the right data in front of analysts and portfolio managers, and to help them interpret it correctly.
Information investors can glean from data includes:
- Current read on business and economic conditions.
- Insights into customer preferences, trends, and satisfaction.
- Industry dynamics including competition, pricing and supply chain issues.
- Management strategy and execution; human capital management.
- Macroeconomic and political trends.
This information is useful for verifying an investment thesis; producing accurate estimates of earnings and returns on capital; and for risk analysis. These are all part of an asset manager’s fiduciary duty. In the near future, asset managers will need to regularly address the question of how they are applying data to carry out their fiduciary duties.
Coming up next: Building an effective data strategy.